Fleet behaviour is the market.
The freight market prices risk it cannot measure. FleetVane is the first standardised volatility benchmark for dry bulk — computed directly from observed vessel movement, not from opinion.
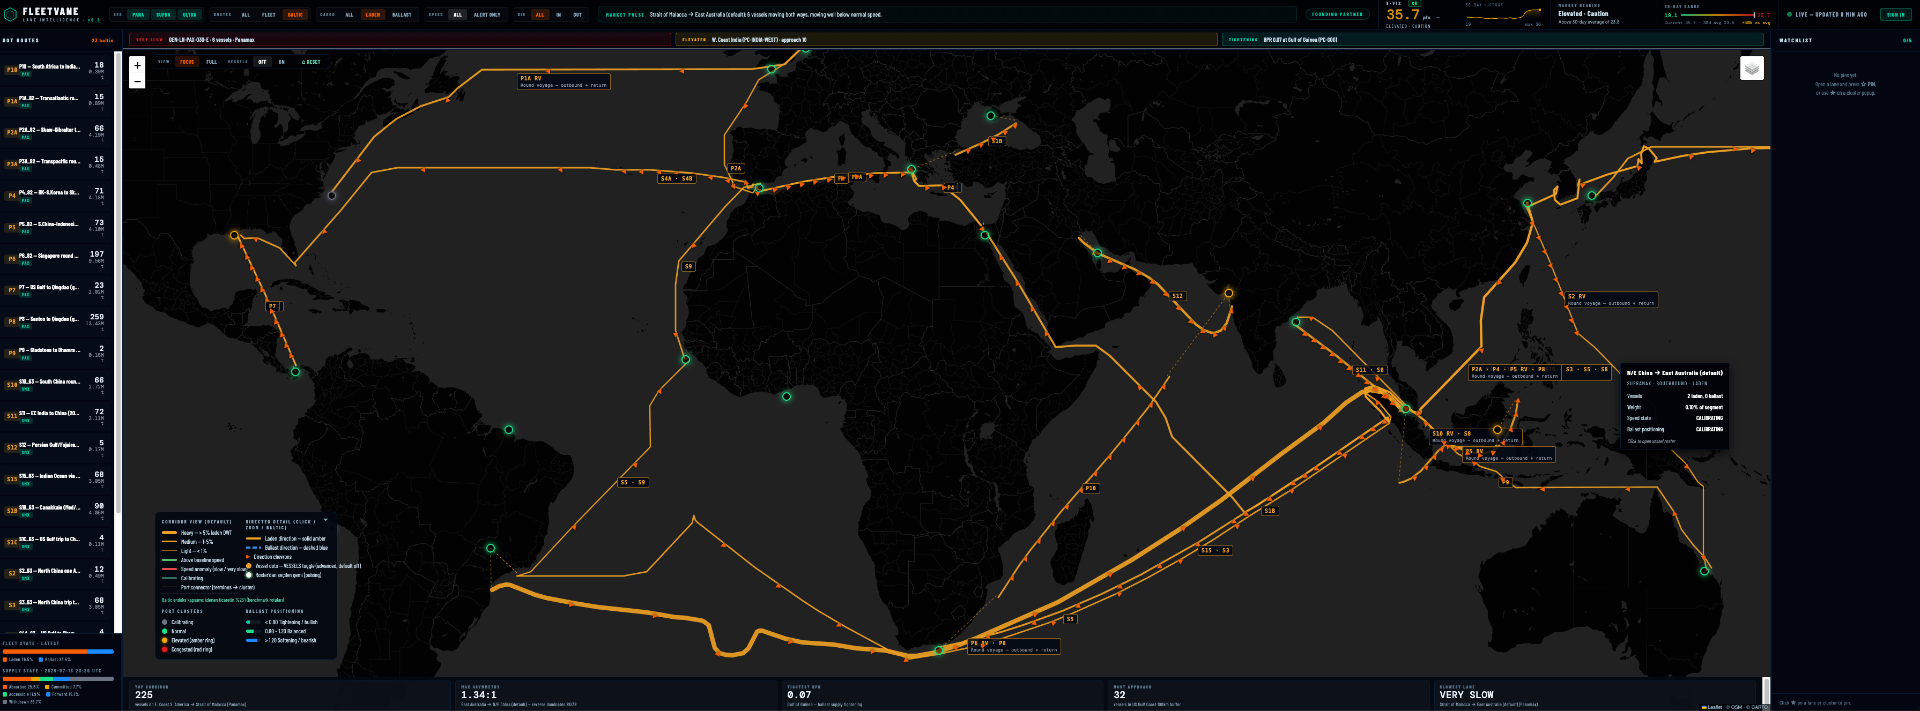
Freight volatility is generated inside the fleet system. Measure it directly and the market state follows.
A market with no measurement
Every freight reference price is assessment-based opinion. There is no volatility benchmark at all. FleetVane occupies empty territory — a category with no incumbent, only an assessment model decades old.
Usage becomes dependence
A decision tool used every morning becomes workflow. A measurement that proves itself becomes a reference. A settlement reference embedded in a live contract cannot be switched off.
History that cannot be bought
The measurement layer is built from a route graph accumulated from observed movement. A late entrant cannot reconstruct it backwards at any capital level.
Lane Intelligence
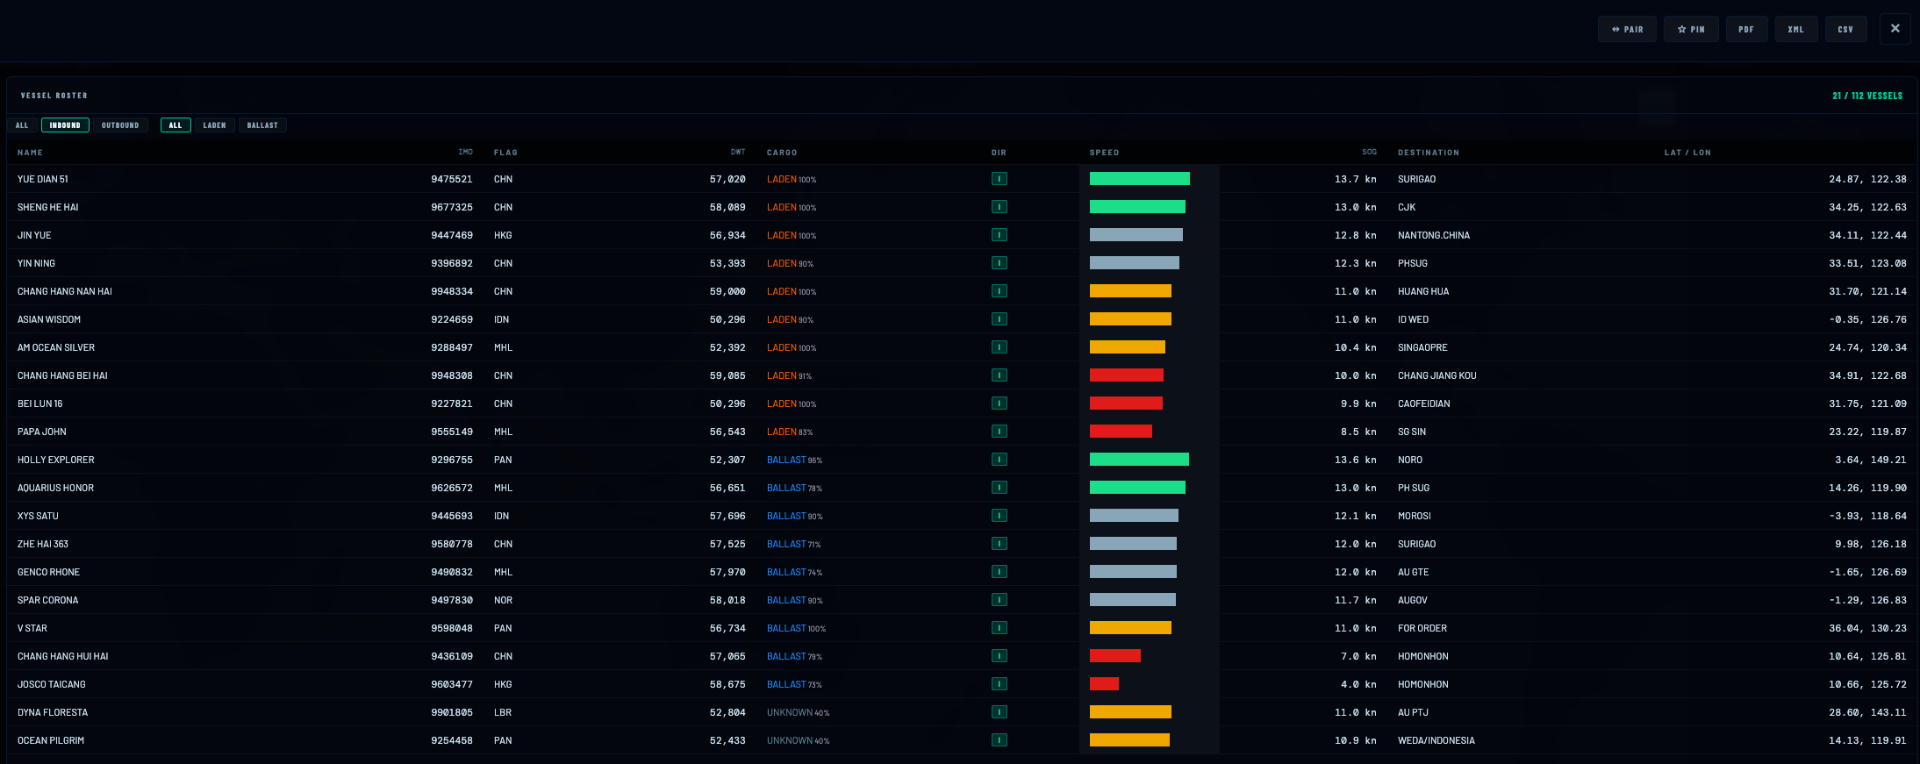
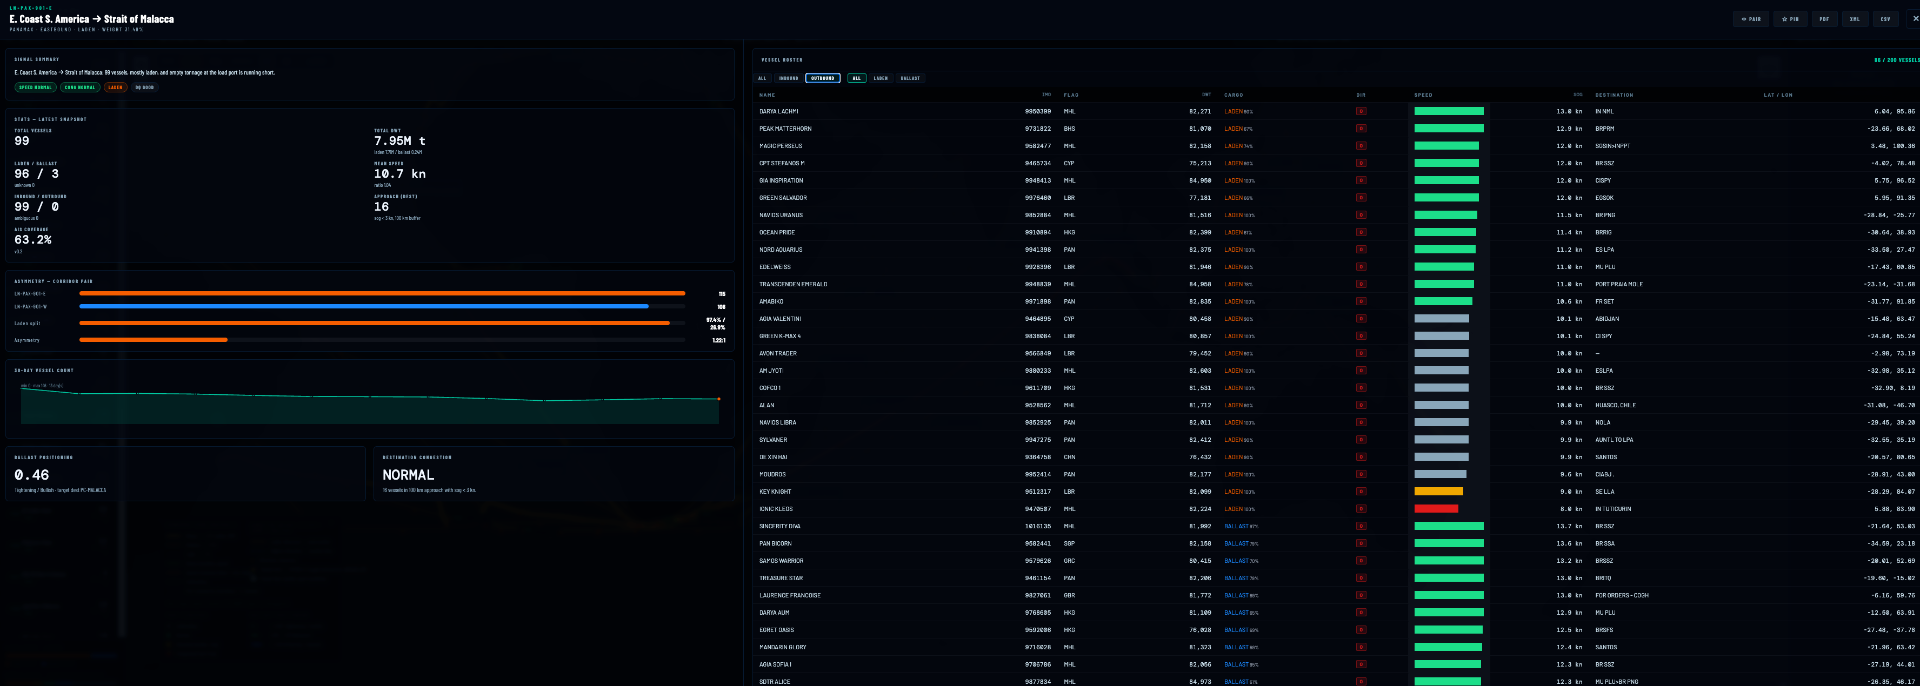
Click any corridor and the market opens up: plain-language signal summary, supply-state snapshot, directional asymmetry, 30-day vessel-count trend, ballast positioning and destination congestion — with the full vessel roster beside it.
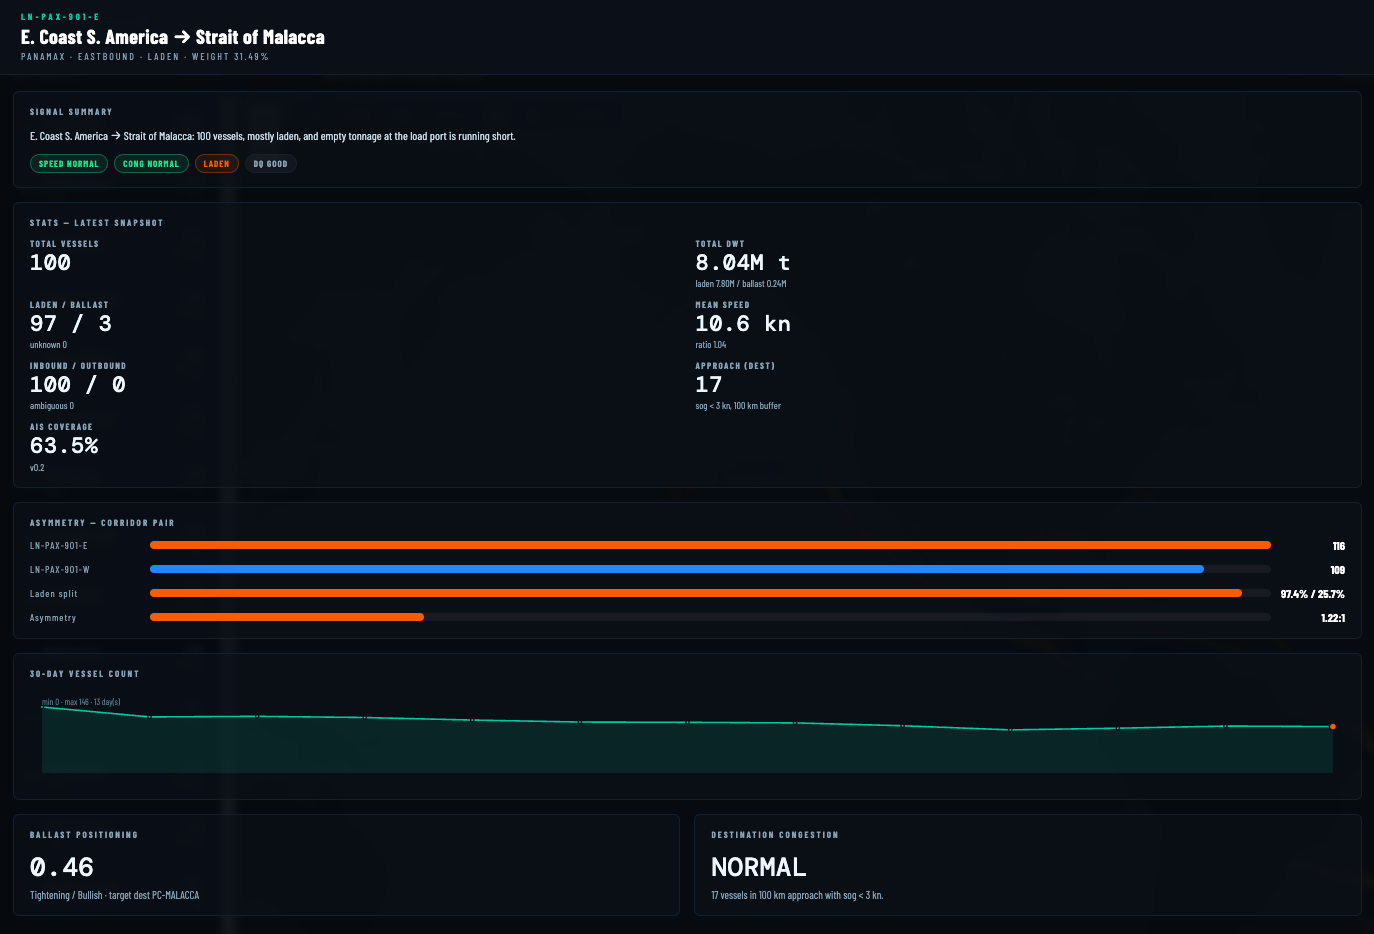
Plain-language read + directional asymmetry as leading supply signal
Tightening or softening · queues at destination
IMO · flag · DWT · cargo state · speed · destination
PAIR · PIN · PDF · XML · CSV on every panel
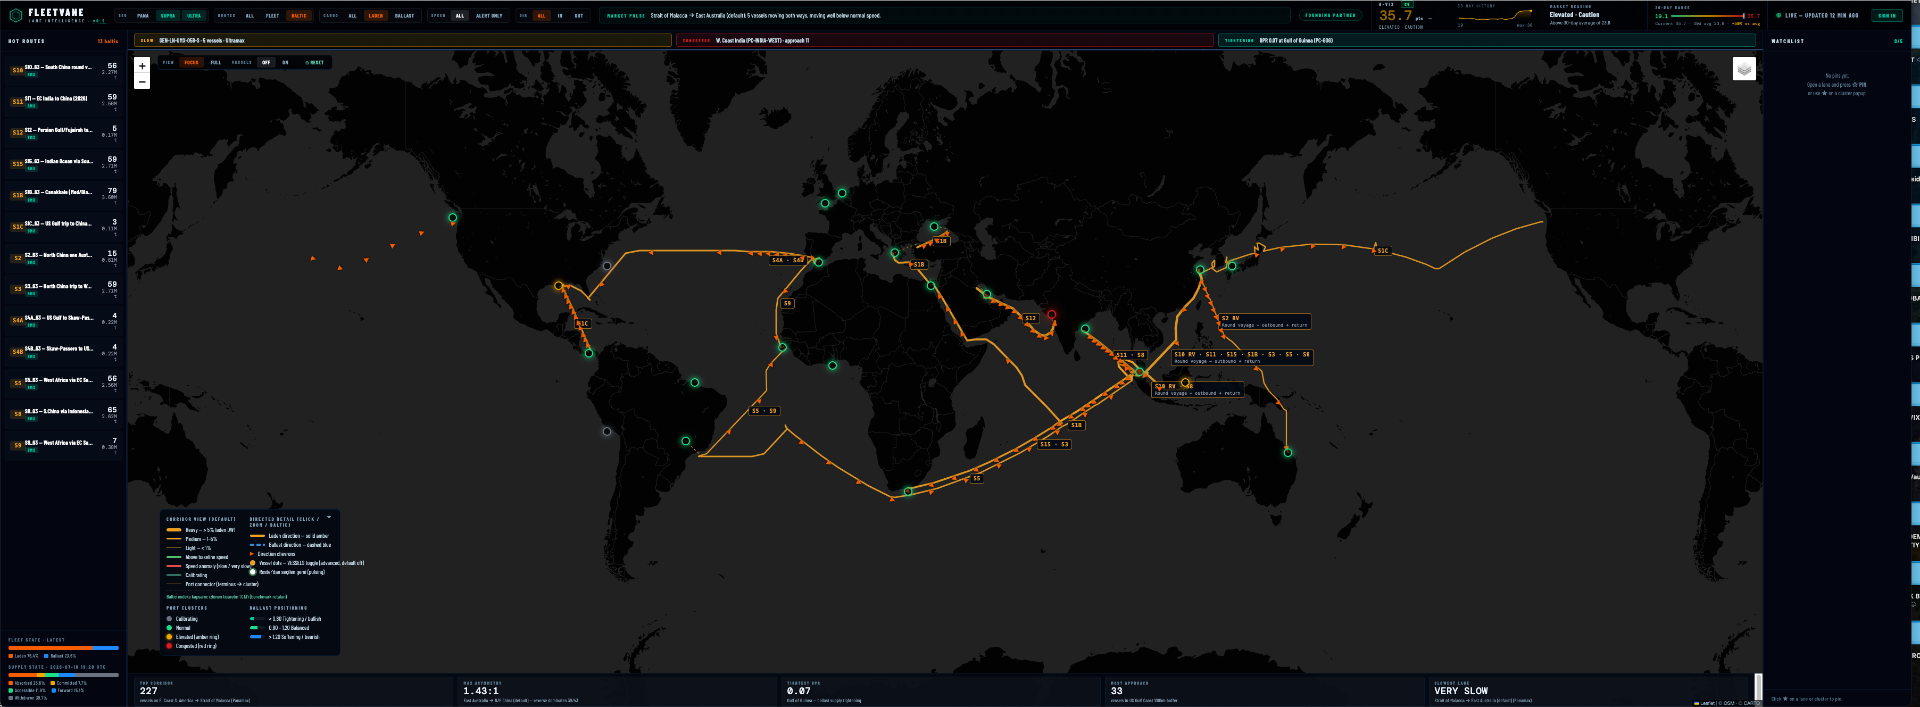
FleetVane Routes vs static benchmark routes.
Static benchmark routes are committee-defined and fixed for years. FleetVane routes are extracted from observed traffic and move with the market — refreshed monthly, evidence-logged.
FVI — the Freight Volatility Index family.
A daily measure of expected 30-day freight volatility per segment — Capesize, Panamax, Supramax — computed entirely from observed fleet behaviour. Base-100, self-referential, structurally resistant to manipulation.
Driven by absorption (+41%) and a slow replenishment pipeline (+26%), partly offset by balanced positioning (-13%) — the reading explains itself.
Absorption pressure · effective supply slack · replenishment pipeline · positioning dispersion · speed-and-congestion friction
Each day's value published with its driver contributions. A measurement, never a black box.
Calm · Normal · Elevated · Crisis — every transition logged and attributed.
Frozen constants · versioned methodology · no silent restatements.
Made only from physics.
No assessed price, forward curve or broker input enters FVI at any stage. Every constant derives from observed fleet behaviour. The independence claim is not a promise — it is a database permission an auditor can read.
Production infrastructure, running today.
A route graph accumulated from observed movement cannot be reconstructed backwards. A late entrant cannot buy this history — at any capital level.
The same measurement. Every desk's decision.
- 01Fixture timing — fix now or wait
- 02Vessel positioning & repositioning
- 03Route selection under live pressure
- 04Freight exposure in commodity trading
- 05Shipping-cycle timing for capital
- 06Fleet planning vs benchmark-blind flows
- 01Volatility reference for FFA positioning
- 02Freight options pricing & surface
- 03Risk modelling & portfolio construction
- 04Cross-asset macro signal on global trade
- 05Countercyclical ship lending
- 06In time — settlement reference for derivatives
Revenue now. A standard later.
Decision SaaS
Lane Intelligence and FleetVane Routes for physical market participants — owners, operators, charterers, commodity desks. Subscription revenue, no regulatory approval required, value visible from the first session.
Benchmark infrastructure
The FVI family, index data licensing and, in time, derivatives referencing. Usage creates trust; trust creates the benchmark. Revenue scales with adoption, not headcount.
A data subscription can be cancelled. A settlement reference embedded in a live contract cannot. FleetVane scales like a software company and earns like an exchange.
From instrument to institution.
Platform live · FVI beta
Three segments computing daily; two-layer route architecture; visual product finalised for first external users.
Founding partners · validation
Institutions onboarded; academic validation study; IOSCO-aligned governance defined.
Global FVI · term structure
Cross-segment headline index; 30/60/90-day readings; coverage expansion.
Licensing · decision layer
Index licensing and referencing; an intelligence layer on the one dataset competitors cannot reproduce.
Every analytics platform in this market contextualises against someone else's benchmark. FleetVane is built to be the benchmark they contextualise against.
A seat at the table as the measurement layer of dry bulk freight is built.
A small group of institutions taken on early — with platform access, methodology briefings under NDA, and direct influence on the route and index roadmap.